Grade B
revise!

| #33 Grade B |
revise! |
|
| try a random GCSE question... |
The
histogram show the distribution of scores of pupils in a maths exam.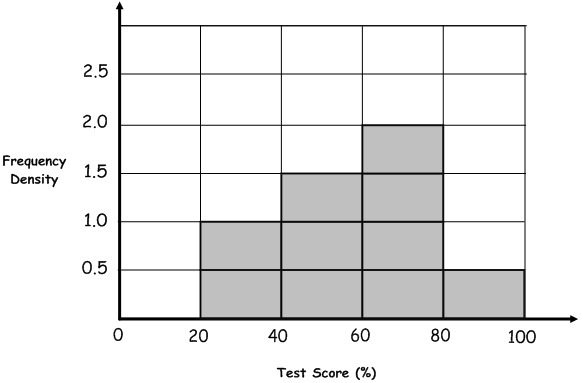 |
||
| a) How many pupils scored less than 40 percent? | ||
| b) How many pupils scored between 40 and 80 per cent? | ||
| c) Work out the median score. |
|
|
| try another? | studymaths.co.uk |
|
� 2010 studymaths.co.uk |