Finding the Mean from Frequency Tables |
| In
your maths exam you
will probably get asked to
find or estimate the mean from a frequency table. It is a 3
or 4
mark question and really easy marks if you can remember the method
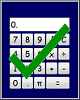
correctly. It is nearly always on your calculator paper.
|
|
| Interactive worksheets: Practice GCSE questions: |
|
Example Question
The table below shows the
selling price of 52 cars in a second hand showroom.
Calculate an estimate of the mean selling price. Give your answer to the nearest pound. |
Solution
| The first thing to note is
that the question says
"estimate". This is because the data is grouped so we don't
know
the exact selling price of each car. Instead we estimate that
each
car was sold for the value in the middle of its grouping. E.g
£1250, £7250 etc. If the data is not grouped you don't have
to do
this! In your exam the table will normally be written to the left hand side of the page. This is so you can add two extra columns to the table, one for "mid point" and one for "frequency x mid point". Remember you don't need a midpoint column if the data isn't grouped!
The mid point values are the middle numbers in each of the groups. An easy way to find these is to add the upper and lower boundary and divide your answer by two. The last column is found by multiplying the mid point by the frequency. E.g. 1250 x 9 = 11250. Finally, to get our answer we add up the Frequency x Mid Point column and divide it by the total frequency. 275000 =
5288.461538
52 = £5288 (nearest £) To check our answer is sensible we make sure that our average price is between £0 and £12500. Otherwise we know we have made a mistake somewhere! |
Test Yourself!
The table below shows the number of pets owned by
40 families.
Calculate an estimate of the mean number of pets. Give your answer to one decimal place. |
 |
||||
|
The table below shows the scores of 26 students in a maths test.
Calculate an estimate of the mean score. Give your answer to the nearest percent. |
| back to key topics |